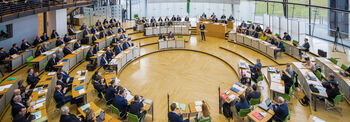
Who sits in the State Parliament?

The 8th Saxon State Parliament was elected on September 1st 2024. Each legislative period is five years. In accordance with the Law on Elections to the Saxon State Parliament, the members are elected in general, direct, free, equal and secret ballots.
60 mandates are given to constituency candidates who are elected directly to the State Parliament as individuals by voters with their direct votes (“first vote”).
The remainder - generally also 60 – mandates are given to parties which receive list votes (“second votes”) from at least five percent of the electorate.
Composition of Parliament
In the 2024 election, the parties received the following percentages of the votes:
|
Party |
Share of votes |
|
CDU (Christian Democratic Union) |
31,9 % |
|
AfD (Alternative for Germany) |
30,6 % |
| BSW (Sahra Wagenknecht Alliance) | 11,8 % |
|
DIE LINKE (Party of Democratic Socialism) |
4,5 % |
|
GRÜNE (Alliance90/The Green Party) |
5,1 % |
|
SPD (Social Democratic Party of Germany) |
7,3 % |
On principle, the Saxon State Parliament is made up of 120 members.
The 120 members of the State Parliament are divided into six parliamentary party groupings (and one independend). Seats are allocated to the parties based on the number of list votes they obtain in the state election.
Seat Distribution
The CDU constitutes the largest parliamentary group with 31.9 % of the party list votes and 41 seats, followed by the AfD with 40 seats (30.6 %). BSW won 15 seats (11.8 %), SPD 10 seats (7.3 %) and BÜNDNISGRÜNE 7 seats (4.5 %). DIE LINKE is the smallest parliamentary group with 6 seats (4.5 %). One member of the parliament does not belong to any parliamentary party grouping, he is independent.
|
Parliamentary party |
Seats |
|
CDU (Christian Democratic Union) |
41 |
|
AfD (Alternative for Germany) |
40 |
|
BSW /Sahra Wagenknecht Alliance) |
15 |
|
SPD (Social Democratic Party of Germany) |
10 |
|
BÜNDNISGRÜNE (Alliance90/The Green Party) |
7 |
|
DIE LINKE (Party of Democratic Socialism) |
6 |
|
independent |
1 |
|
total |
120 |
Gender Distribution
The gender distribution in the State Parliament is 33 women to 87 men. Women thus make up 27,50 % of members. There are significant differences between the parliamentary party groups. In the BÜNDNISGRÜNE group, women are in the majority, at 57.14 %. In the SPD and in DIE LINKE group, women account for 50,00 %. In the BSW and in the CDU parliamentary group, women are in the minority at 33.33 % and 29.27 % respectively. The AfD parliamentary group also has a minority of women, at 10.00 %.
|
female (absolute) |
female (percentage) |
male (absolute) |
male (percentage) |
total |
|
|---|---|---|---|---|---|
|
CDU |
12 |
29,27 % |
29 |
70,73 % |
41 |
|
AfD |
4 |
10,00 % |
36 |
90,00 % |
40 |
|
BSW |
5 |
33,33 % |
10 |
66,67 % |
15 |
|
SPD |
5 |
50,00 % |
5 |
50,00 % |
10 |
|
BÜNDNISGRÜNE |
4 |
57,14 % |
3 |
42,86 % |
7 |
| DIE LINKE | 3 | 50,00 % | 3 | 50,00 % | 6 |
|
independent |
0 |
0,00 % |
1 |
100,00 % |
1 |
|
total |
33 |
27,50 % |
87 |
72,50 % |
120 |
Age Distribution
|
Members |
20-30 years |
31-40 years |
41-50 years |
51-60 years |
61-75 years |
total |
|---|---|---|---|---|---|---|
|
CDU |
2 |
6 |
13 |
12 |
8 |
41 |
|
AfD |
1 |
3 |
8 |
19 |
9 |
40 |
|
BSW |
0 |
3 |
5 |
3 |
4 |
15 |
|
SPD |
0 |
3 |
5 |
1 |
1 |
10 |
|
BÜNDNISGRÜNE |
0 |
1 |
4 |
2 |
0 |
7 |
|
DIE LINKE |
1 |
0 |
3 |
1 |
1 |
6 |
|
independent |
0 |
0 |
0 |
1 |
0 |
1 |
|
total |
4 |
16 |
38 |
39 |
23 |
120 |
|
percentage |
3,33 % |
13,33 % |
31,67 % |
32,50 % |
19,17 % |
100,00 % |
Age distribution in total and by parliamentary party group. Date: October 2024
